기능 맵을 시각화하는 방법
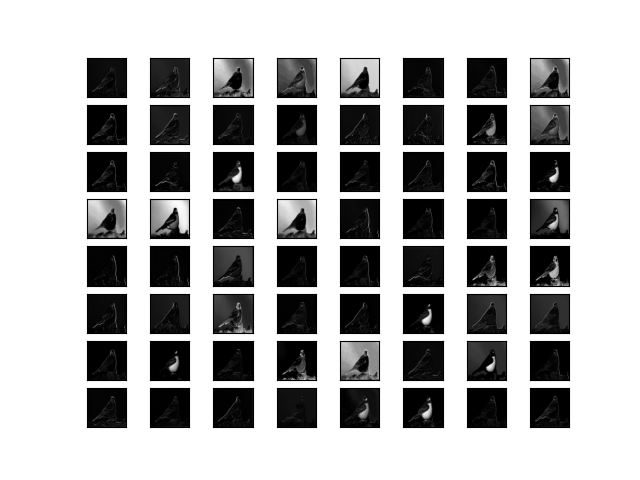
기능 맵이라고하는 활성화 맵은 입력 이미지 또는 다른 기능 맵과 같은 입력에 필터를 적용한 결과를 캡처합니다.
특정 입력 이미지에 대한 특성 맵을 시각화하는 아이디어는 특성 맵에서 감지되거나 보존되는 입력 특성을 이해하는 것입니다. 입력에 가까운 기능 맵은 작거나 세분화 된 세부 사항을 감지하는 반면 모델 출력에 가까운 기능 맵은보다 일반적인 기능을 캡처합니다.
(1pixel이 의미하는 바가 layer를 거치기 전에는 부리의 일부분 깃털의 일부분이라면 layer가 진행되면 진행될수록 부리, 깃털, 날개, 몸톰, 새, 이미지천체 한 픽셀에 담기는 데이터 정보가 점점 커져간다. 이것 때문에 피라미드 구조가 나오게 됨)
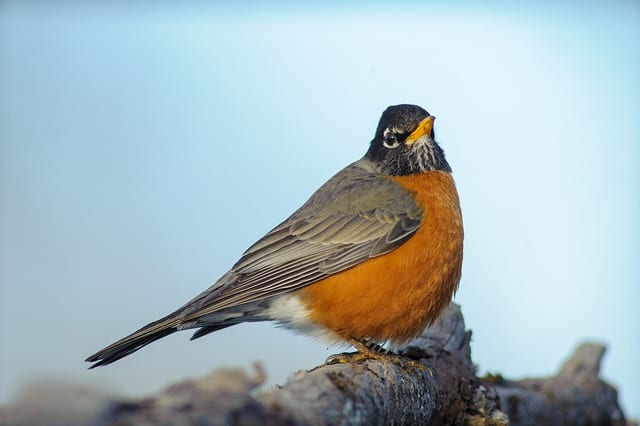
기능 맵의 시각화를 탐색하려면 활성화를 만드는 데 사용할 수있는 VGG16 모델에 대한 입력이 필요합니다. 간단한 새 사진을 사용합니다. 특히, Chris Heald가 촬영 한 Robin 은 허용 라이센스에 따라 릴리스되었습니다.
사진을 다운로드하고 파일 이름이 ' bird.jpg '인 현재 작업 디렉토리에 배치합니다

STEP1. - 먼저 이미지를 VGG16에서 사용하는 input size로 가져옵니다
데이터 불러오기 -> 데이터 전처리 -> 모델 train&val -> 모델 test -> inference(service)
[학습에서는 데이터의 dependency가 강력하기 때문에 데이터의 일관성이 굉장이 중요함. 본 이미지 데이터 분석은 나중에 이미지 프로젝트 진행시 이미지 데이터를 분석을 하기 위한 초석으로 보면 될 듯 싶다.
import cv2
from tensorflow.keras.models import Model
import numpy as np
from keras.applications.vgg16 import VGG16
from matplotlib import pyplot

#load the image with the required shape
img = cv2.imread('bird.jpg',cv2.COLOR_BGR2RGB)
img = cv2.resize(img,(224,224))
print(img.__class__)
print(img.shape)
STEP2. - 데이터 차원 확장 및 전처리
데이터 차원확장은 이번에 사용하는 데이터가 하나이기 때문에 따로 차원확장을 진행해줬다. [ N, H, W, C], [ N, C, H, W] C,H,W의 순서는 opencv냐 아니냐에 달라질 수는 있으나 (tensorflow, pytorch의 차이도 존재) 기본적으로 4차원으로 들어가야한다.
img = np.expand_dims(img, axis=0) # 차원확대

img = img/255.0 # 이미지 scaling
STEP3. - 모델을 불러오기
# load the model
model = VGG16()
# summarize featu

model = Model(inputs=model.inputs, outputs=model.layers[1].output)
STEP4. - 예측하기
feature_maps = model.predict(img)
STEP5. - 결과확인
# plot all 64 maps in an 8x8 squares
square = 8
ix = 1
for _ in range(square):
	for _ in range(square):
		# specify subplot and turn of axis
		ax = pyplot.subplot(square, square, ix)
		ax.set_xticks([])
		ax.set_yticks([])
		# plot filter channel in grayscale
		pyplot.imshow(feature_maps[0, :, :, ix-1], cmap='gray')
		ix += 1
# show the figure
pyplot.show()
각 레이어에 대한 이미지 feature값들도 확인해보자
input에서 output으로 나오는 각각의 layer의 이미지들을 출력값으로 뽑은 이미지들이다.
# visualize feature maps output from each block in the vgg model
from keras.applications.vgg16 import VGG16
from keras.applications.vgg16 import preprocess_input
from keras.preprocessing.image import load_img
from keras.preprocessing.image import img_to_array
from keras.models import Model
from matplotlib import pyplot
from numpy import expand_dims
# load the model
model = VGG16()
# redefine model to output right after the first hidden layer
ixs = [2, 5, 9, 13, 17]
outputs = [model.layers[i].output for i in ixs]
model = Model(inputs=model.inputs, outputs=outputs)
# load the image with the required shape
img = load_img('bird.jpg', target_size=(224, 224))
# convert the image to an array
img = img_to_array(img)
# expand dimensions so that it represents a single 'sample'
img = expand_dims(img, axis=0)
# prepare the image (e.g. scale pixel values for the vgg)
img = preprocess_input(img)
# get feature map for first hidden layer
feature_maps = model.predict(img)
# plot the output from each block
square = 8
for fmap in feature_maps:
	# plot all 64 maps in an 8x8 squares
	ix = 1
	for _ in range(square):
		for _ in range(square):
			# specify subplot and turn of axis
			ax = pyplot.subplot(square, square, ix)
			ax.set_xticks([])
			ax.set_yticks([])
			# plot filter channel in grayscale
			pyplot.imshow(fmap[0, :, :, ix-1], cmap='gray')
			ix += 1
	# show the figure
	pyplot.show()


'vison_study' 카테고리의 다른 글
| Chap3. 신경망 (밑바닥부터 딥러닝) (0) | 2021.12.27 |
|---|---|
| 2.1 퍼셉트론 (밑바닥부터 딥러닝) (0) | 2021.12.22 |
| Torch tensor to numpy(in use Opencv) (0) | 2021.06.28 |
| Vison_study #1 (0) | 2021.06.27 |